
Ionospheric Studies at ISR
The ISR has numerous projects to explore the phenomenology of the Earth's ionosphere, the region of the Earth's upper atmosphere that is dominated by ions and free electrons. Investigations include studies of ionospheric disturbances around the globe, from Antarctica to the tropics, and complex simulations of these effects of these disturbances on communication, navigation, and radar systems.
Ionospheric Studies
Magnetosphere-Ionosphere (MI) coupling
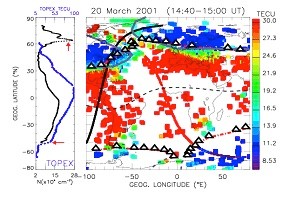
Flow of energy between the magnetosphere and ionosphere is known to be the dominant source of ionospheric density enhancement at auroral and sub-auroral latitudes. This effect expands to lower latitudes particularly during geomagnetic storms. Studies suggested that the ionospheric plasma is transported sunward and poleward from a source region at middle and low latitudes in the afternoon sector, which is associated with the large-scale enhancement of the ionospheric convection electric field during disturbed geomagnetic conditions, forming a latitudinally narrow region of storm-enhanced plasma density (SED) that convects sunward extending toward higher latitudes. It is well known that these SED plumes are associated with the erosion of the outer plasmasphere. However, the rates of SED plume formation difference at different longitudinal sectors are still not fully understood. We have been utilizing data from multi-instrument observations and making significant progress toward this effort.
Equatorial Electrodynamics
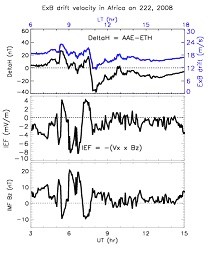
It is now well documented that ionospheric and plasmaspheric density irregularities and gradients are the prime candidate for the failure of our navigation and communication systems especially during magnetically active periods. Despite much progress in the study of ionospheric and plasmaspheric density structure and dynamics in the last decade, there are many gaps in our global understanding of the fundamental electrodynamics that governs equatorial ionospheric density irregularities and gradients. The uneven distribution of ground-based instruments has been the main barrier that hinders our ability to obtain a global understanding of the dynamics and structures of the ionosphere. Most of ground-based instruments are located in dense regional arrays in North America, Europe, Asia, and recently in South America. However in Africa, where some of the most intense ionospheric density irregularities occur, observations of the state of ionospheric plasma and its driving electrodynamics are not possible due to lack of ground-based instruments. In order to have a complete global understanding of equatorial ionosphere motions, we deployed AMBER magnetometer arrays in four African countries and also proposed ACORN GPS receivers’ network to be deployed in Africa.
ACORN Project in Africa
The proposed ACORN GPS network will play a vital role in the effort to advance global understanding of the dynamics and structure of the ionospheric density irregularities. The prime objective of ACORN is to monitor the complex and extreme state of disturbance that occurs in the magnetic-equatorial ionosphere nearly every day after sunset as has been observed by satellite observations, and the electrodynamics of the plasma density that creates the proper conditions to initiate plasma turbulence. Satellite observations show unique equatorial ionospheric structures only in the African sector, though these have not been confirmed, validated or studied in detail by ground-based observations due to lack of suitable ground-based instrumentation in the region.
Ground- and Space-based Tomography
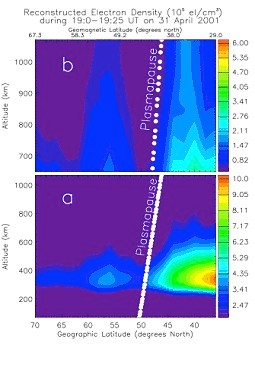
The TEC measurements by themselves are just a collection of line integrals of the free electron density and not maps of the electron density distribution or structure. The dramatically growing number of GPS receivers on the ground and onboard Low-Earth-Orbit (LEO) satellites offers an excellent opportunity for remote sensing and monitoring of the ionospheric and plasmaspheric density structure using tomographic reconstruction technique. This allows us to clearly quantify M-I coupling dynamics, as well as confirm the long-standing conjecture that the mid-latitude trough and plasmapause are on the same field line. We have been performing in imaging F-region ionospheric and topside ionospheric and plasmaspheric density structures and dynamics by applying tomographic inversion techniques to ground- and space-based observations, respectively.
Point of Contact for this project is Dima Paznukhov.
Radio Wave Propagation Modeling
The distribution of free electrons in the ionosphere is dictated by production from solar radiation, transport, and loss through chemical recombination. It is also subject to instability mechanisms that generate large-scale depletions and irregularities in the ambient electron density over a wide range of spatial scales (plasma turbulence). Radio waves that propagate through these irregularities experience scattering and diffraction, causing random fluctuations in amplitude and phase referred to as scintillations. The scintillation of satellite signals can severely degrade the performance of satellite communications systems, global navigation systems such as the Global Positioning System (GPS), and space radars used to conduct cloud-free, day-and-night observations of the Earth’s surface. Ionospheric irregularities and scintillations constitute one of the most important space weather threats to technological systems of the modern world which increasingly rely on trans-ionospheric radio propagation.
Propagation through Random Ionospheric Irregularities
To predict the impact of ionospheric scintillation on communications, navigation, and space radar systems it is often necessary to simulate the RF conditions under which these systems must operate. This involves physical modeling of the disturbed ionosphere followed by phase screen or full-wave propagation techniques. While the simplest ionospheric irregularity models assume statistically homogenous turbulence, in reality the electron density fluctuations are most commonly distributed within discrete plumes that are best described by an inhomogeneous phenomenological model. A realistic simulation must account for the motion of the transmitter and receiver platforms, the drift and anisotropy of the irregularities, and the oblique angle of propagation, all of which determine the scale sizes of the turbulence sampled by the radio wave. ISR staff have developed algorithms to simulate RF conditions in highly realistic scenarios which take all of these aspects into account for space-to-ground, ground-to-space, and space-to-space propagation scenarios.
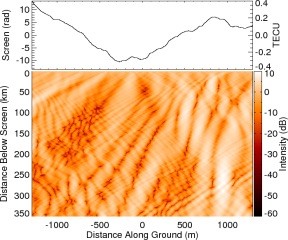
For example, the top panel in the figure below shows the total phase change imparted to a 250 MHz radio wave after propagation through the ionosphere. In this example, the ionosphere is modeled as a homogenous layer of irregularities statistically described by a power law with a phase spectral index of 3. The bottom panel in the figure shows the intensity of the radio wave as a function of distance below the layer and also distance along the ground. The dark and light regions represent fades and enhancements of the wave, respectively, caused by defocusing and focusing of the wave as it propagates. A receiver samples the radio signal along the ground, and when the signal fades below the margin of the receiver, communications or navigation systems that depend on it are disrupted. Note the qualitative resemblance to the dark and light regions at the bottom of a pool of water, which are caused by refraction of the light from above. The physical mechanisms at work in both cases are closely related.
GPS Scintillation
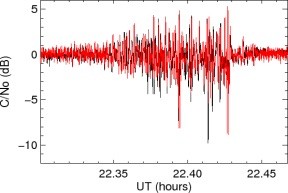
Severe scintillation of the GPS satellite signals can result in loss of satellite tracking, which degrades GPS positioning accuracy. Even when satellite tracking is maintained, scintillation can cause errors decoding the GPS data messages, cycle slips, and ranging errors. To predict the performance of GPS under different ionospheric conditions, phase screen techniques can be used to simulate the received signal on the ground. The figure below compares the measured (black) carrier-to-noise ratio of a GPS satellite signal and the results of a phase screen simulation (red) using the measured phase as a proxy for the phase screen. The phase screen model accurately reproduces the statistics of signal fluctuations, and in this case reproduces the temporal structure of the signal on a fade-by-fade basis.
Radio Occultation Scintillation
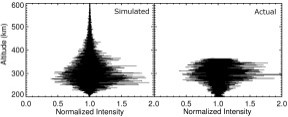
Staff at the ISR have developed the Radio Occultation Scintillation Simulator (ROSS), which uses the multiple phase screen technique to simulate the forward-scatter of radio waves by irregularities in the equatorial ionosphere during radio occultation experiments. ROSS simulates propagation through equatorial plasma bubbles which are modeled as homogeneous turbulence modulated by spatial functions with local support. The figure below shows a comparison of the simulated signal intensity with the actual signal intensity measured by the CORISS instrument onboard the C/NOFS satellite.
Scintillation Impacts on Space Radar
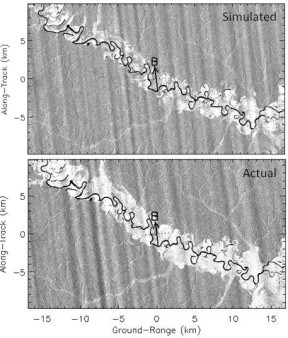
Synthetic aperture radar (SAR) is a widely used remote sensing technique for continuously monitoring changes on the Earth’s surface from space. The superior resolution of the SAR technique is achieved by the coherent processing of multiple pulses transmitted by the radar as it moves in its orbit. This coherent processing creates a synthetic aperture, much larger than the aperture of the physical antenna, along the satellite track. Amplitude and phase fluctuations which decorrelate across the synthetic aperture, however, reduce the effective resolution of the SAR image. Staff at the ISR have developed the SAR Scintillation Simulator (SAR-SS), a phase screen technique for simulating the impact of small-scale ionospheric structure on SAR image formation and interferometry. The figure below compares simulated and actual imagery of the Amazon River Basin in Brazil measured by the PALSAR instrument onboard the ALOS satellite. The figure demonstrates that SAR-SS can reproduce the essential features of streaking and contrast degradation caused by small-scale structure in the ionosphere. The arrow points in the local magnetic field direction, which is closely related to the direction of the ionospheric streaks.
Point of Contact for this project is Charles Carrano.
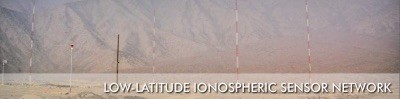
Low-Latitude Ionospheric Sensor Network (LISN)
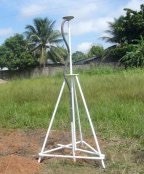
Boston College is an active partner in the construction and operation of the Low-Latitude Ionospheric Sensor Network (LISN), an international project to monitor the low, middle and high atmosphere in the equatorial region of South America. LISN is a permanent Distributed Observatory of new geophysical instruments in South America near the Magnetic Equator and 70 degrees West Longitude.
LISN will acquire and process data through an assimilative physics-based model that will produce accurate estimates of ionospheric electron density distributions, conductivities, ExB plasma drifts, and neutral winds in near real time.
An observatory model capable of estimating plasma densities, ion drifts and neutral winds over a large geographic area present a logistical challenge. However, realizing anticipated advances in equatorial Aeronomy, development and testing of forecasting capability of ESF regionally, and prototyping distributed low-latitude observatories create opportunities to establish sites around the globe.
Point of Contact for this project is Keith Groves.