Student survey results
Findings identify strengths, areas for improvement regarding the student experience at Boston College.
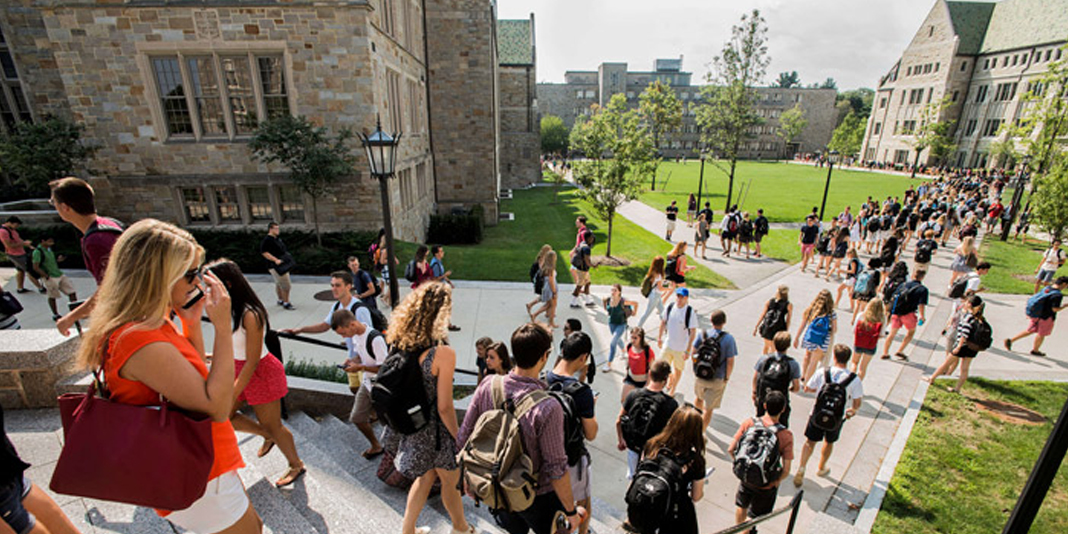
The summary of the Student Experience Survey is now available. The results show a lot of what is right about BC—86% of Boston College students would recommend BC to others and 75% would choose to go to BC again—and also some areas where we need to improve.
Designed by a University-wide team of students, faculty, and administrators, the survey was created to gain a better understanding of the BC student experience both inside and outside of the classroom, by examining students’ views on University mission, academics, student services, culture, and community.
2,417
BC undergraduate students
Sample | Population | |||||
% | N | % | N | |||
College | ||||||
MCAS | 65% | 1563 | 65% | 6140 | ||
Carroll School | 21% | 496 | 24% | 2249 | ||
Lynch School | 9% | 213 | 7% | 621 | ||
CSON | 6% | 145 | 5% | 433 | ||
Race/Ethnicity | ||||||
American Indian or Alaska Native | 0% | 0 | < 1% | 2 | ||
Asian | 15% | 363 | 10% | 967 | ||
Black or African American | 3% | 75 | 4% | 372 | ||
Hispanic of Any Race | 11% | 252 | 11% | 1035 | ||
Native Hawaiian or Other Pacific Islander | < 1% | 2 | < 1% | 3 | ||
Two or More Races | 5% | 115 | 3% | 329 | ||
White | 66% | 1581 | 60% | 5632 | ||
Gender | ||||||
Male | 35% | 843 | 47% | 4444 | ||
Female | 65% | 1563 | 53% | 4999 | ||
Other | <1% | 11 | Not available | |||
Family Income | ||||||
Below $50,000 | 11% | 238 | 14% | 531 | ||
$50,000-$149,999 | 30% | 643 | 31% | 1205 | ||
$150,000 and over | 42% | 918 | 55% | 2102 | ||
Not sure | 17% | 374 | - | - | ||
Sexual Orientation | ||||||
Heterosexual | 90% | 1963 | Not available for population |
|||
LGBQ | 9% | 195 | ||||
Other | 1% | 23 | ||||
International | ||||||
International | 6% | 126 | 8% | 723 | ||
Not international | 94% | 2061 | 92% | 8720 |
86%
would recommend BC to others
93%
are intellectually engaged
87%
have done volunteer work
75%
developed a stronger sense of purpose
The Student Experience Survey was administered from October through December 2018. It was developed to gain a better understanding of undergraduate students and their experiences at Boston College.
There will be a presentation of results at the Student Affairs Administrator / Student Forum on May 6. Watch for an email from the UGBC president in the coming weeks, which will include a link to register.
Data will be shared with UGBC leadership and University leadership over the upcoming weeks. The findings of the survey will also be shared with the University-wide Diversity Steering Committee, which is composed of administrators, faculty, staff and students. The committee will be charged with reviewing the results and proposing actionable initiatives to address the concerns raised in the survey. University leadership will continue to explore the data to learn more about the overall student experience at BC.
Contact us through this form or reach out directly by emailing surveys@bc.edu.