

Along the East Coast of the United States, relative sea level change does not happen uniformly between Maine and Florida.
Data have shown that sea level rise in the Mid-Atlantic region surpassed changes in relative sea level along the coastlines of the South Atlantic and the Gulf of Maine. A team of researchers including Boston College Assistant Professor of Earth and Environmental Sciences Carling C. Hay took a look back at historical data through new analytical methods to pinpoint the reason behind the different rates of sea level change.
Assessing data from a range of sources and previous studies, the team concluded that the movement of the earth – referred to as vertical land motion – is the dominant force behind variations in rates of sea level rise up and down the East Coast, the team reported in a the journal Nature.
Across the past century, records indicated that sea level rise has varied – from approximately 1.5 feet along the shores of the Chesapeake Bay in Virginia and the beaches near Cape Hatteras, North Carolina, to approximately one foot near New York City and Miami. Along the coast of Maine, sea level rose only about a half a foot.
The team found that vertical land motion is the primary factor influencing the spatial variability in relative sea level rates, explaining 75 percent of the observed variation along the East Coast, according to the report, titled “Origin of spatial variation in the U.S. East Coast sea-level trends during 1900-2017.” More than two-thirds – or 69 percent – of the observed vertical land motion is due to ongoing effects from the last ice age.
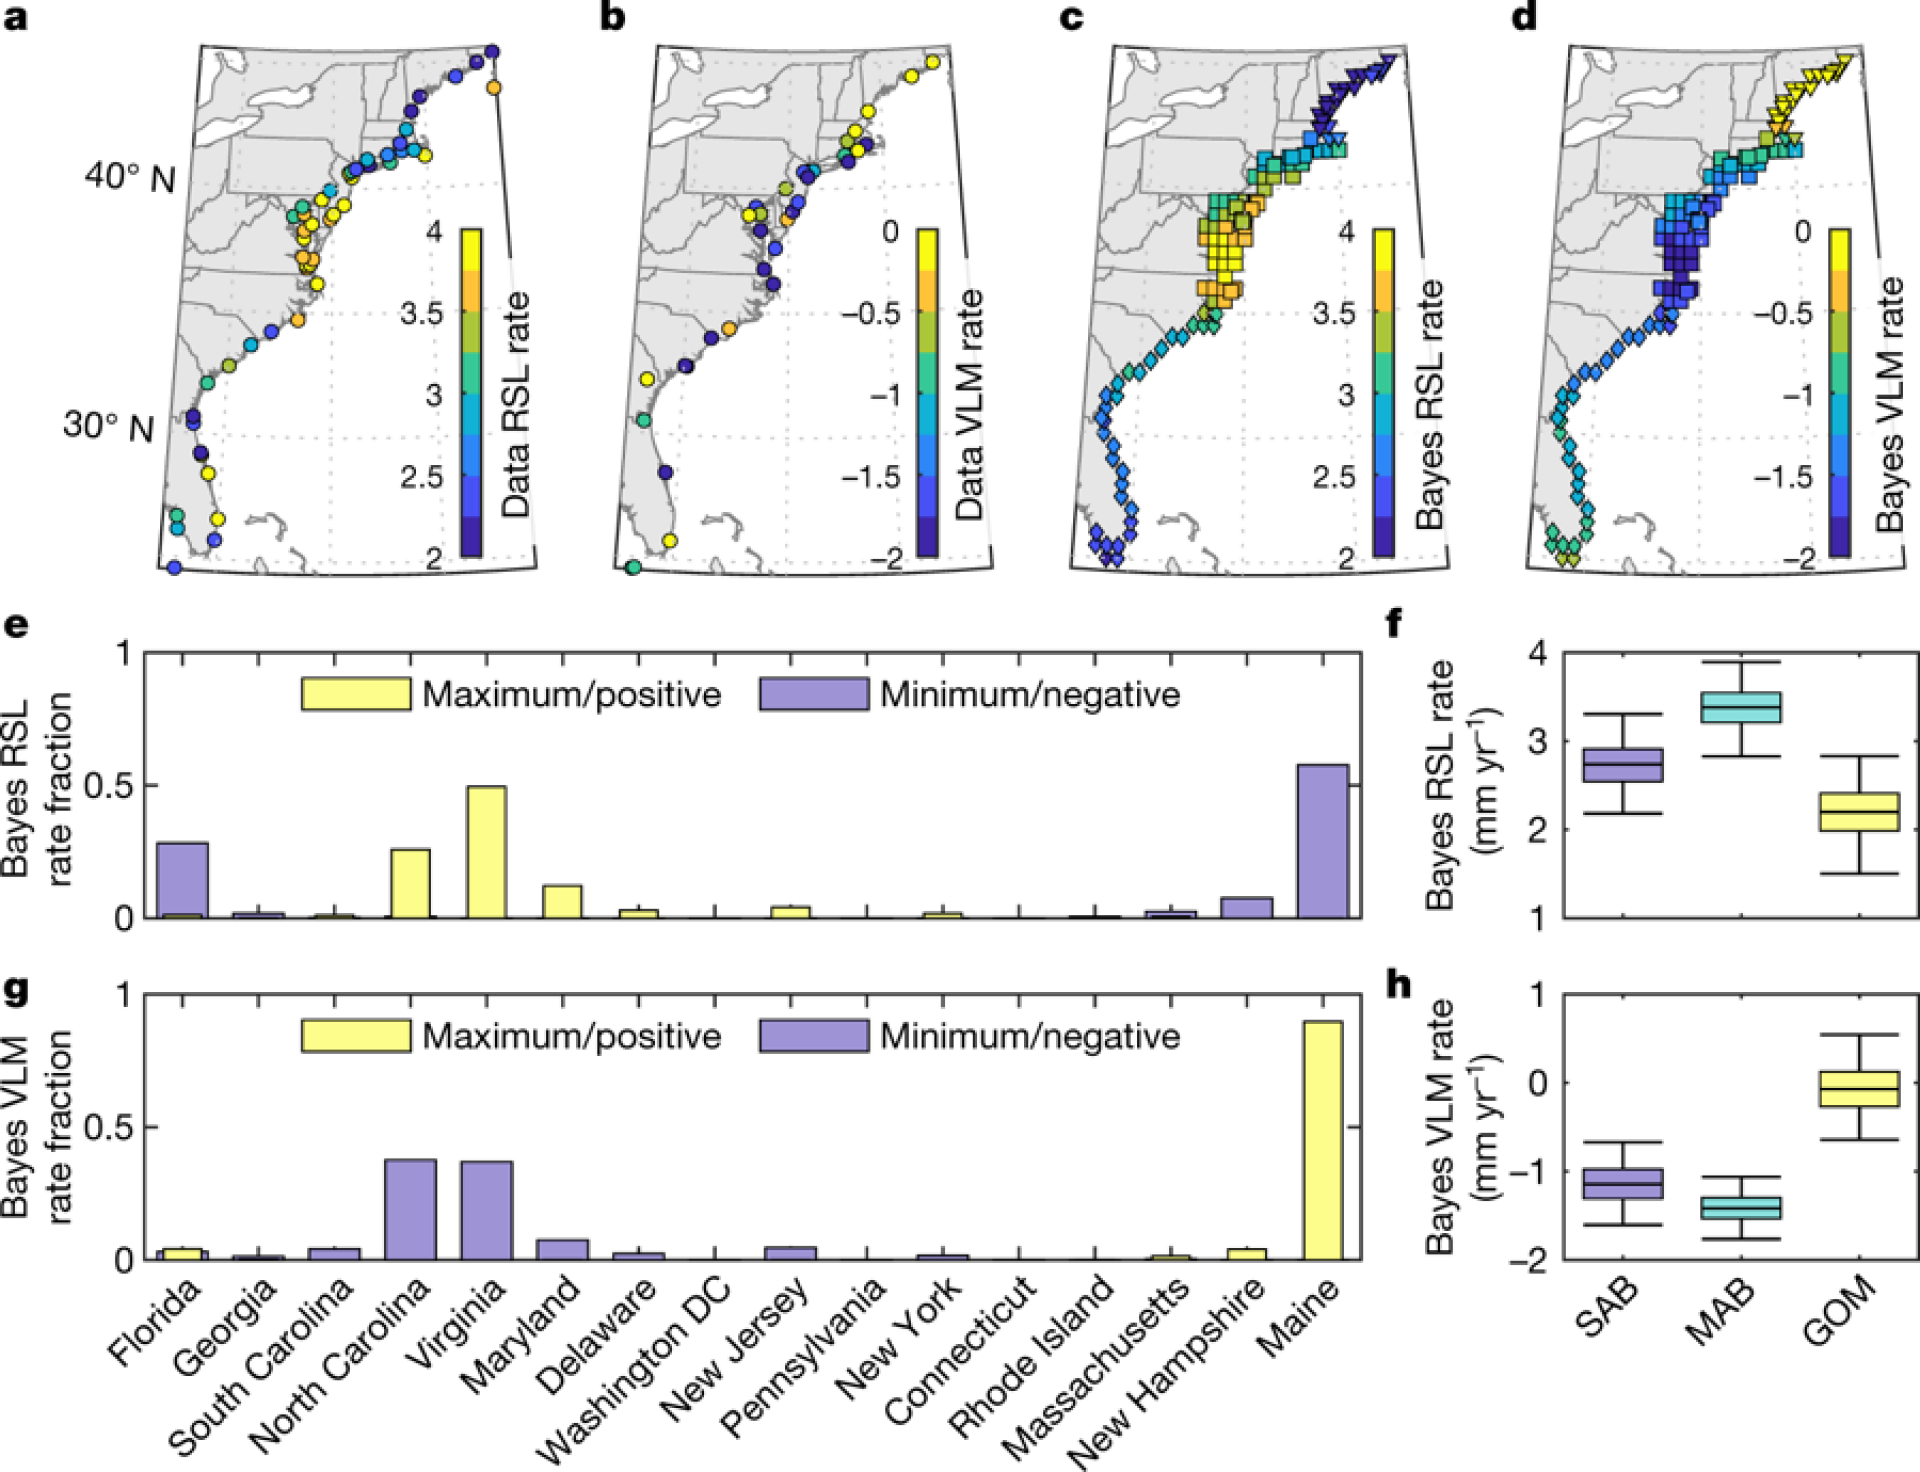
“This ice age effect is the largest in Maryland, Virginia, and North Carolina,” said Hay, who co-authored the report with colleagues from Woods Hole Oceanographic Institution, Harvard University, Tufts University, and Atmospheric and Environmental Research, Inc.
“The remaining sea level trends that cannot be explained by vertical land motion also exhibit significant structure, with rates of sea level rise increasing from northern Maine to southern Florida,” Hay said. “This spatial structure is consistent with patterns associated with the combined effects of ice melt, groundwater pumping, and dam building over the last century.”
This study brings together, within a statistical framework, observations and reconstructions of sea level, vertical land motion data, and physical models of ongoing sea level changes due to the last ice age to determine the sources of the observed variability in 20th century sea level trends, according to Hay.

Carling Hay
“We set out to determine whether ongoing sea level changes due the last ice age are driving differences in rates of sea level change along the U.S. East Coast,” said Hay. “Previous studies have disagreed on the source of this variability, mostly because no previous study combined all the different data sources and models, and their respective uncertainties, in a statistically robust framework.”
The researchers examined data across the current and last centuries, including a combination of tide gauge observations, GPS data, sea level reconstructions from salt marsh data, and models of long-term sea-level changes due to previous ice age cycles. They then used statistical methods to include all sources of uncertainty and make connections between the different data sets and models. The statistical analysis allowed the team to determine which processes are dominating sea level change in different regions along the coast, Hay said.
Given the results of earlier studies, Hay said the team did not expect to pinpoint the largest sea level changes due to the last ice age so far south along the coast.
“We were surprised that the largest rates of sea level change due to the last ice age are found in Maryland, Virginia, and North Carolina,” said Hay. “Numerous previous studies have suggested that the largest ice age effect is in New York, New Jersey, and Delaware. We were also surprised to find that the sea level rates not associated with vertical land motion still exhibit significant spatial trends. This had not been observed in previous work.”
“ Previous studies have disagreed on the source of this variability, mostly because no previous study combined all the different data sources and models, and their respective uncertainties, in a statistically robust framework. ”
Hay said it is important to note that while some of the sea level trends along the coast are influenced by climate change, this study targets sea level changes due to moving land, specifically those associated with the ongoing effects of the last ice age.
“While vertical land movement due to the last ice age is both the dominant driver of the spatial variability in sea level rates and a significant contributor to local sea level change, present day ice melt and heating of the oceans also play a large role in explaining the observations,” Hay said.
Hay said the next steps in this line of research will be to include additional sea level factors in the statistical model so that researchers can further explore the sources of spatial variability along the coast.
DOI: 10.1038/s41586-018-0787-6
Ed Hayward / University Communications | January 2019