NSF grants for Boston College computer scientists
Computer Science Assistant Professors Donglai Wei and Nam Wook Kim have received major grant awards from the National Science Foundation that will fund projects related to, respectively, human-centric machine learning and improving the quality of data visualization for data analysis.
Wei was selected for a coveted $600,000 NSF CAREER grant, which supports junior faculty in the sciences through the Faculty Early Career Development Program, while Kim was awarded a competitive $350,000 NSF Collaborative Research Grant as the principal investigator in a project with the University of Wisconsin.
“We are delighted to witness the continued rise in our department’s research productivity, which has been driven to an important degree by our talented junior faculty,” said department chair Professor Sergio Alvarez. “These two colleagues have had success in involving undergraduate students in their research. We congratulate them on their achievements and look forward to more exciting developments in our department’s research and teaching in the coming years.”

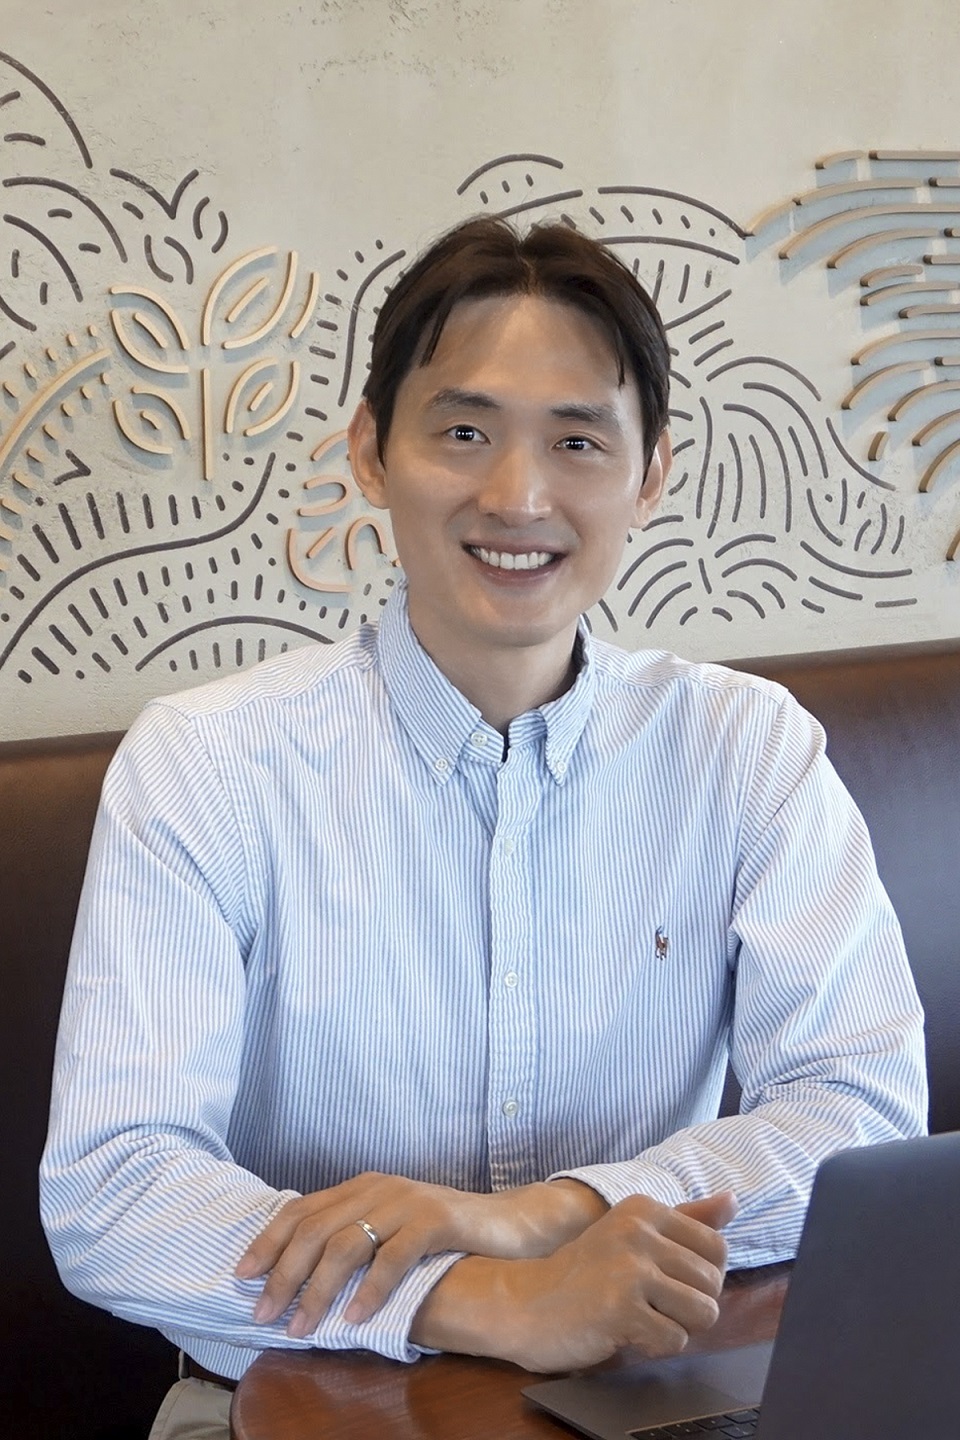
Donglai Wei (Lee Pellegrini)
Wei’s research is rooted in the field of connectomics, which aims to reconstruct connections between various parts of the brain from extremely high-resolution microscopy images. This technology can provide detailed renderings of the brain at the cellular level to reveal the organizing principle and the mechanism of neural connectivities, yielding new insights that could accelerate the development of treatment for neurodegenerative diseases and inspire novel AI algorithms.
His goal is to improve the neutron reconstruction method that is key to the process, and develop a human-centric approach to automate the labor-intensive workflows before and after the reconstruction—for example, data annotation to train the model and error correction to refine the results. This project will build a scalable human-centric computational pipeline with novel algorithms to mimic human cognition to significantly reduce human effort in the pipeline.
“Among the specific objectives will be to build automatic agents that will learn from domain experts’ proofreading strategies so they can detect and correct automatic reconstruction results,” said Wei. “We’ll also develop transfer learning methods to reuse labeled connectomics datasets and pre-trained models to assist biology labs in analyzing their microscopy images. Accompanying our research aims will be comprehensive evaluations on collected benchmark datasets and accessible software resources for the biomedical image-analysis community.”

Nam Wook Kim
Kim’s project will investigate how to organize data visualization empirical research better and make it more accessible to visualization creators as easily consumable practical guidelines, and improve their data visualization literacy. He envisions a general, readily accessible body of knowledge, methods, and standards for producing data visualizations, as well as a venue through which such guidelines can easily be discussed and updated as needed.
“We are surrounded by data and data visualizations have become a mainstream tool for understanding and communicating data,” he said. “Journalists, scientists, analysts, designers, developers, and just casual users produce data visualizations these days, but typically they are not very aware of the impact of their design choices and often rely on hunches. For example, they choose a pie chart over a bar chart even though too many categories make it illegible—and bar charts are faster to parse for human eyes for accurate comparison. Ill-formed visualizations can contribute to spreading bad information.”
Kim noted that the project will employ a “citizen science” approach to investigate the unexplored design space in real-world visualizations that involve design elements absent in typical empirical studies.
“The design space of data visualization is combinatorially large and complex,” he explained. “Visualization practitioners produce many different visualizations—such as those based on visualization perception theories—that have not been studied in the past: Scientists came up with Muller charts and Sequence Logo, for example, while others invested in Tornado charts and Marimekko charts. We’ve seen a flood of visualizations during important events like elections or pandemics.
“Researchers are trying to catch up, but the pace of innovation often makes that difficult. I propose finding ways to leverage practitioners in evaluating their effectiveness, such as empowering them to run experiments with their own visualizations.”
